Research
Atm
Model atmospheres
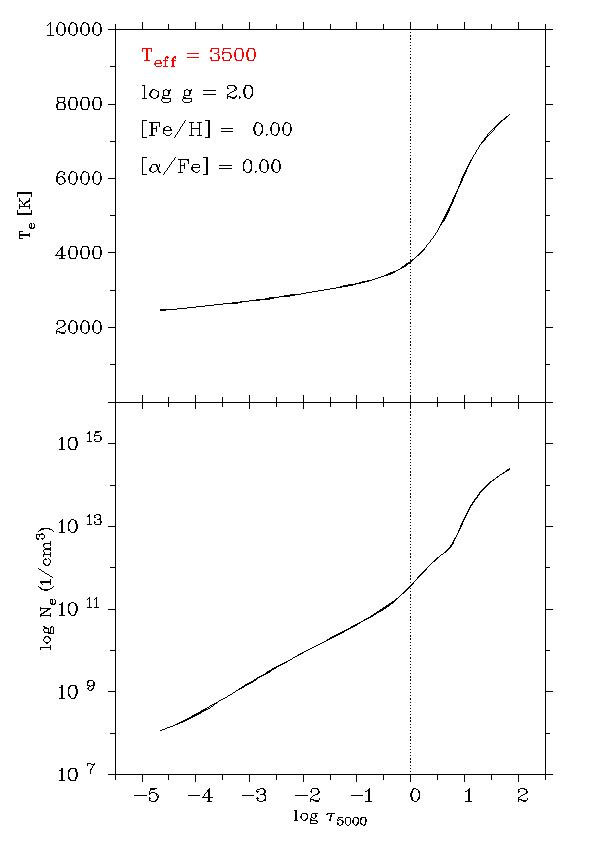
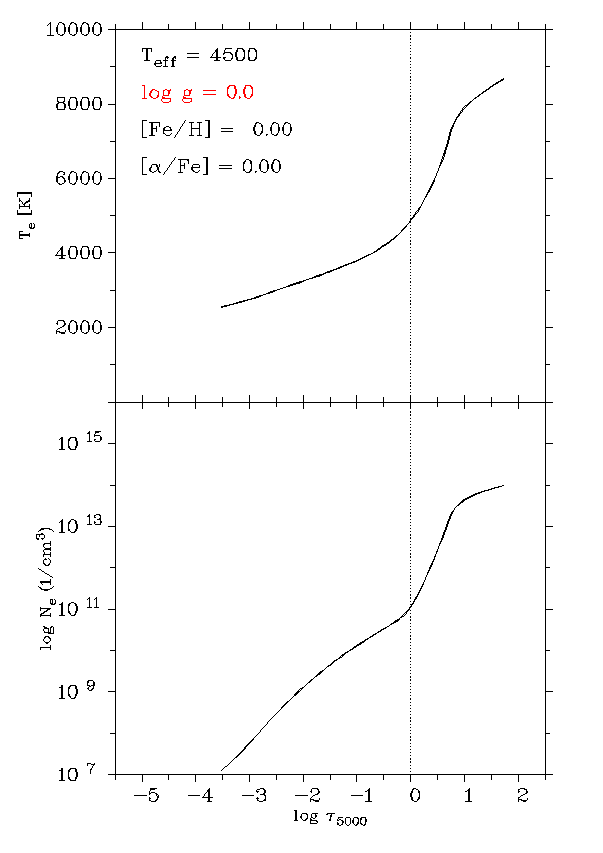
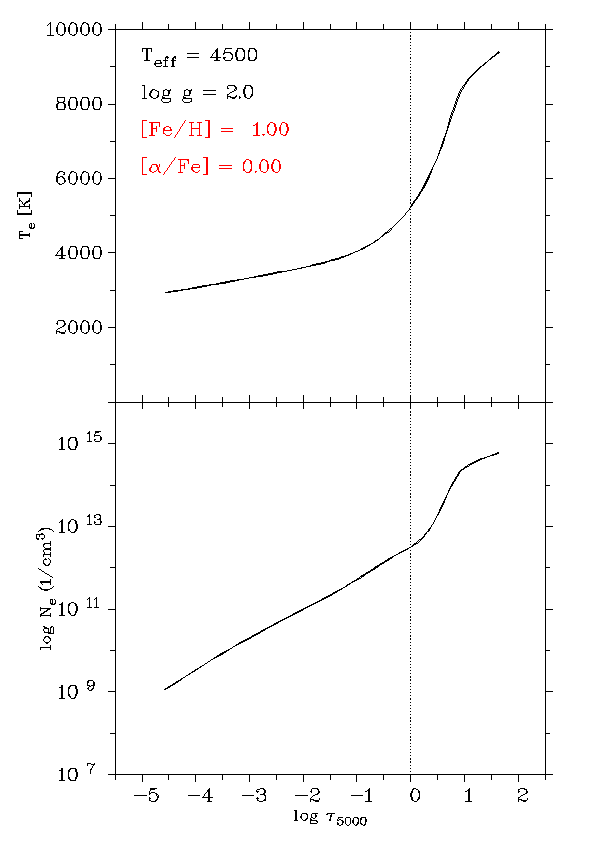
A 1D, LTE model atmosphere is characterized by a temperature and a free electron density profiles as a function of optical depth in the continuum at 500 nm.
Here is available variation of MARCS model atmospheres as a function of:
LTE synthetic spectra
Synthetic spectra are calculated using Turbospectrum (Alvarez & Plez 1998; Plez 2012) a very efficient 1D LTE radiative transfer code and the MARCS model atmospheres (Gustafsson et al 2008).
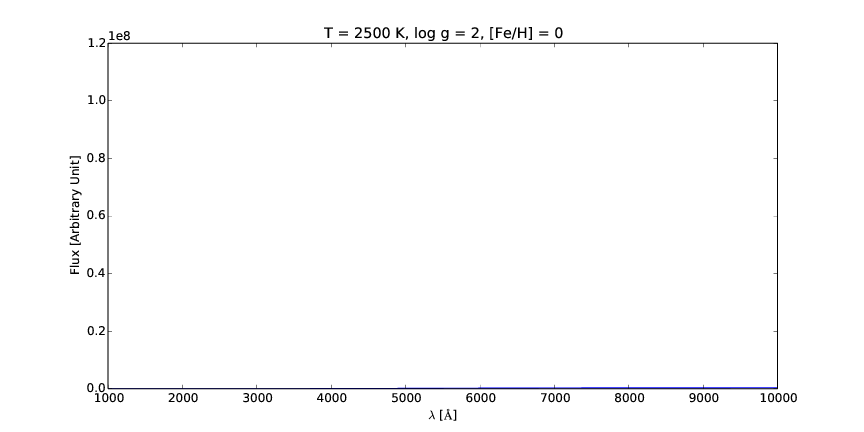
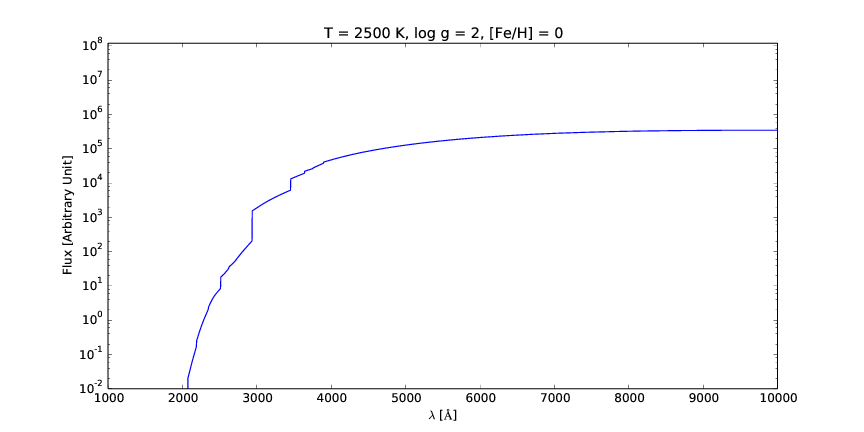
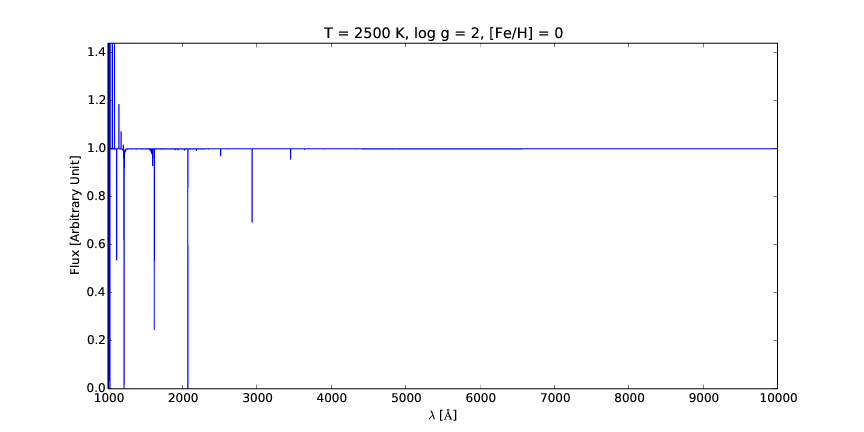
- Spectral variation of hydrogen lines with temperature:
- for a giant star in absolute flux, in logarithmic scale to better see the flux at low temperatures, and in normalized flux to the continuum.
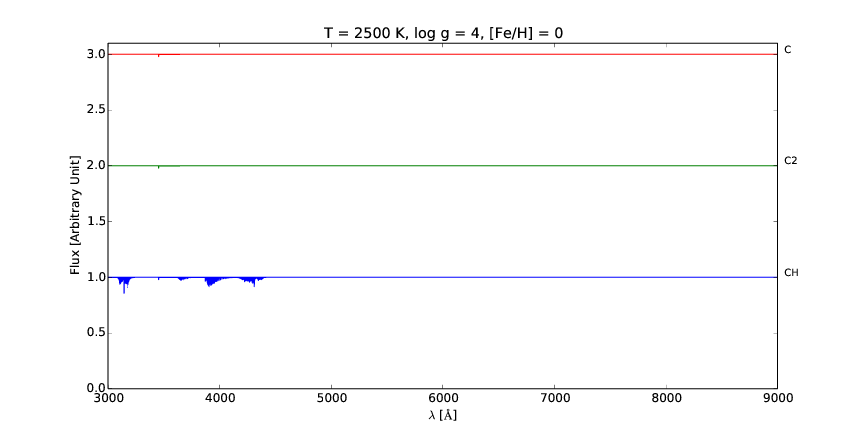
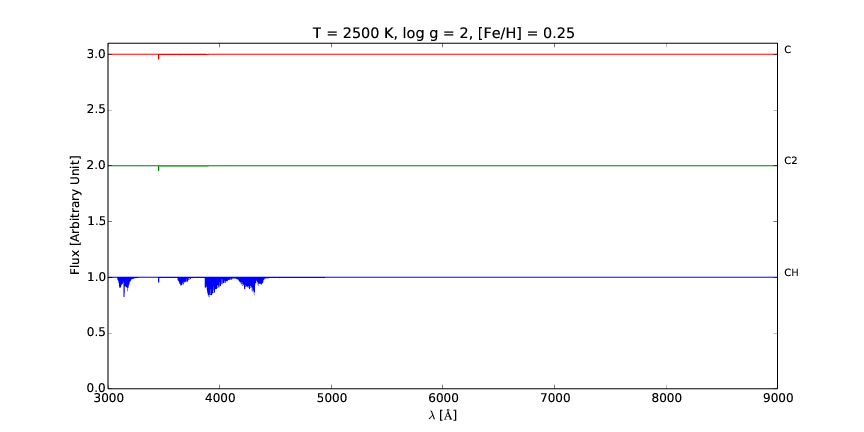
- Evolution of the strength of C, C2 and CH lines with temperature:
- for a dwarf star
- for a giant star
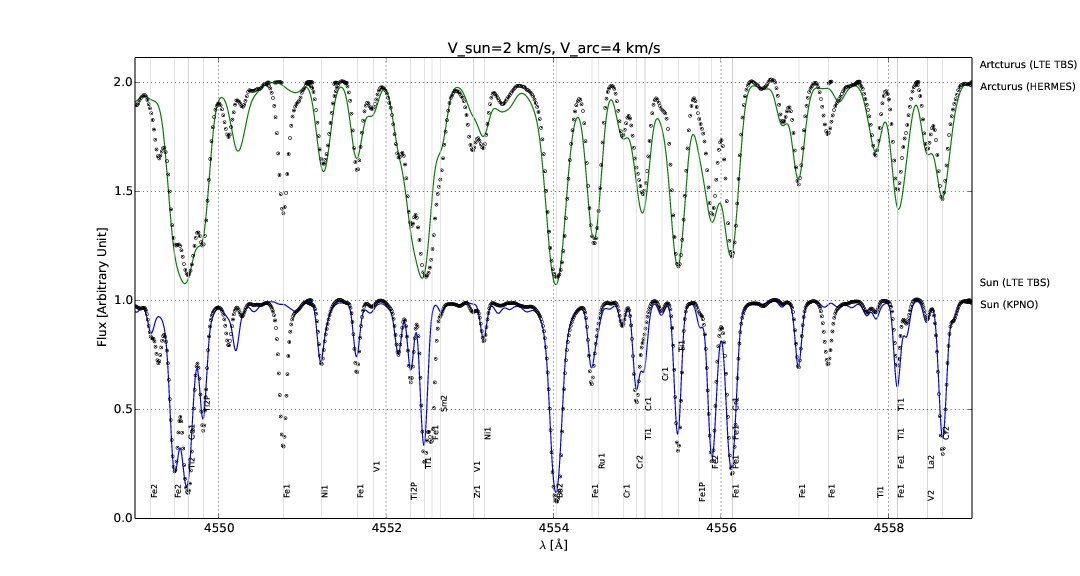
- Comparison of Ba II resonance and satellite lines in the Sun (yellow dwarf) and Arcturus (red giant). 5 lines of Ba II are showed here:
- 455.4 nm
- 493.4 nm
- 585.4 nm
- 614.2 nm
- 649.6 nm
Stellar populations
A globular cluster Omega Centauri change in its Hertzprung-Russell diagram! From Anderson, van der Marel & Bacon, Space Telescope Science Institute.
Or how to move from a spatial to a physical picture of a stellar population.